
Often, when drawing a chart, there’s a need to show a threshold – basically a line that indicates whether your values are going above or below it. Take for example this ColumnChart:
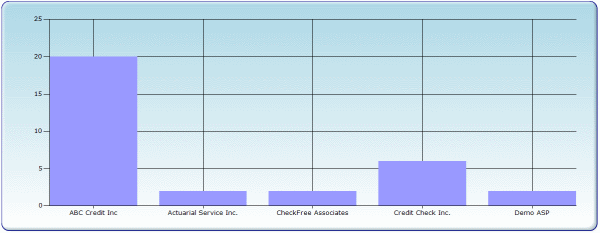
Let’s say we need to show a threshold for the value of 7. Here’s how. Continue reading →