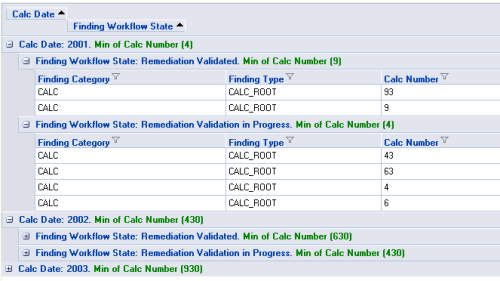
This post continues topic started in “WHDG: Correctly detect Async Callback“. Back then I described a way to correctly detect server-side when an infragistics control (WebHierarchicalDataGrid) issues an async callback.
But what if you need to detect actual type of the call and distinguish paging from sorting from filtering from row expanding? Well, where there is will there is way. Infragistics says there’s no build-in flag indicating AJAX action, but we can determine the action by intercepting and interpreting HTTP Request object.
First let’s define a return type in form of an Enum describing all possible outcomes (it’s always good to work strongly typed values):
Public Enum GRID_AJAX_CALL_TYPE
NON_AJAX = 0
PAGING = 1
SORTING = 2
FILTERING = 3
CHILD_POPULATING = 4
End Enum
And now actual function. In the previous post I described that presence of AJAX call can be determined if key starting with "__IGCallback" is present in Request.Form collection. By interpreting actual value of Request item with that key we can determine type of AJAX call. For example, when grid’s row is expanding during load-on-demand, it contains JSON data "eventName":"Populating","type":"loadOnDemand" so our function simple has to catch it:
Function GetGridAjaxCallType() As GRID_AJAX_CALL_TYPE
Dim sIgCallBackKey As String = HttpContext.Current.Request.Form.AllKeys.SingleOrDefault(Function(S As String) S IsNot Nothing AndAlso S.StartsWith("__IGCallback"))
Dim sIgCallBackRequest As String
If sIgCallBackKey <> "" Then
sIgCallBackRequest = HttpContext.Current.Request.Form(sIgCallBackKey)
'Detecting Child Populating.
If sIgCallBackRequest.Contains("""eventName"":""Populating"",""type"":""loadOnDemand""") Then Return GRID_AJAX_CALL_TYPE.CHILD_POPULATING
Return GRID_AJAX_CALL_TYPE.NON_AJAX
Else
Return GRID_AJAX_CALL_TYPE.NON_AJAX
End If
End Function
The function tries to locate "__IGCallback" key in HTTP request (Line 2), if the key present – function reads actual Request value (Line 6) and if Load-on-demand populating is detected (Line 9) – returns result saying so, otherwise returned result indicated non-ajax call.
This example implements only one detection – Load-on-demand populating, I will leave it to you to add sorting/filtering/paging detection. Once implemented – usage is pretty straightforward:
If Not IsPostBack Then
'...
Else
If GetGridAjaxCallType() = GRID_AJAX_CALL_TYPE.CHILD_POPULATING Then
RebindTheGrid()
End If
End if
When Infragistics WebDataGrid perform AJAX operations such as sorting and paging – it sends grid data directly to page’s DOM. But it also allows you to send your own custom data via server-side GridResponse object and its client-side counterpart. This feature allows you to establish effective link between server and client to perform custom operations otherwise available only during full postback or partial postback via update panel. There’re multiple cases where this can be used, let’s take a look at 3 most common:
Updating a related control with server-side generated data
Running a server-side generated JavaScript
Handling server-side errors, for example Session timeout
Ever wished your WebDataGrid could have Table Layout = Auto like old UltraWebGrid? Then it could automatically resize columns width to data width with respect line breaks. Well, it can, and in style (pan intended). Thanks to Infragistics tech-support for starting me in the right direction – here’s first 2 steps that need to be taken:
Don’t set column width property – either default or for specific column either in server-side code or declaratively and don’t set grid’s width property
Open your grid CSS class file, it’s located at~/ig_res/[Your Style Name]/ig_dataGrid.css.
Locate tbody.igg_[Your Style Name]Item>tr>td class and add one more line at the end: white-space:nowrap. Here is an example with Office 2007 Style:
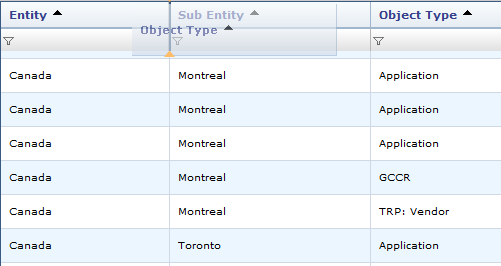
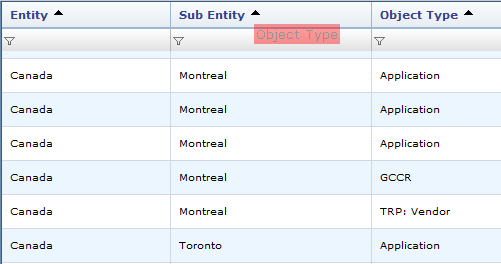
Infragistics Aikido WebDataGrid offers a nice built-in ColumnMoving behavior. When enabled – it allows user to drag columns to change their order:
But what if you want to keep this behavior and add your own custom column drag-and-drop? For example to create your own column grouping, since WebHierarchicalDataGrid doesn’t handle grouping well.
In this post I will describe a simple technique how to both keep behavior shown above and implement custom column drag-and-drop:
Infragistics UltraWebGrid offers extensive client-side Object model and objects at several level of hierarchy offer “.find” method to locate cell with specific data. For example to locate a cell with specific text in a specific column – following code can be used:
//Find cell in first grid column with text "67"
var oGrid = igtbl_getGridById('xmyGrid')
var iLookUpValue = '67'
var oFoundCell = oGrid.Bands[0].Columns[0].find(iLookUpValue, false)
This works, but unfortunately the “.find” method searches for cell’s text instead of value, thus finding any partial match. In the example above cells with values 567, 671 etc. will be found which is no good in many cases, for example when you’re looking for a numeric ID.
Fortunately the “.find” method accepts regular expression as a search parameter. The solution is to apply “^…$” RegEx expression to perform exact match. So if we change the last line in the code above to:
var oFoundCell = oGrid.Bands[0].Columns[0].find('^' + iLookUpValue + '$', false)
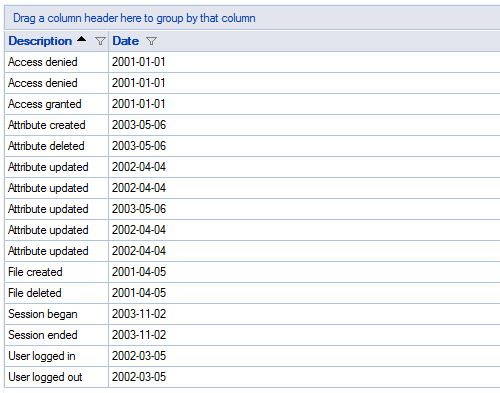
Infragistics UltraWebGrid offers a nice grouping feature: when the grid is in OutlookGroupBy mode, you can group similar data with very little coding required, you can go from this view:
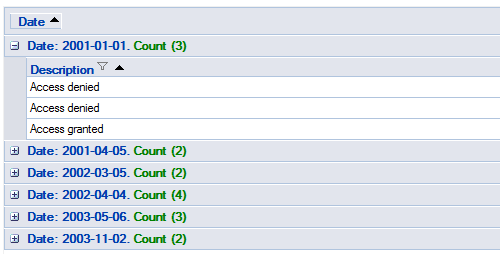
to this:
by just dragging columns to designated area.
But what if you want to group by first letter of a name or a year of a date? New WebHierarchicalDataGrid control offers this functionality after 10.2 release of Infragistics NetAdvantage, but if you invested years of work in classic UltraWebGrid – it’s not easy to move to a brand new control cold turkey. There’re other methods that offer custom grouping for UltraWebGrid, but the ones I found were pretty convoluted (like create a hidden column, populate it with data to group by etc.) Here is a simpler approach. Continue reading 'Custom grouping in classic Infragistics UltraWebGrid'»
Let’s say you need to add a column to an existing table that already contains some rows. And this new column needs to be prepopulated with a default value. For example integer nullable column NEW_COLUMN is added to table MY_TABLE. Common approach is to check for column existence, and if it doesn’t exist – create and populate it:
if not (exists(SELECT * FROM SYSCOLUMNS WHERE ID = OBJECT_ID('[dbo].[MY_TABLE]') AND Name = 'NEW_COLUMN'))
BEGIN
ALTER TABLE [dbo].[MY_TABLE] ADD [NEW_COLUMN] [int] NULL
UPDATE [dbo].[MY_TABLE] SET [NEW_COLUMN] = 1
END
But this doesn’t work – you get “Invalid column name” error. The trick is – you don’t need a separate UPDATE statement. ALTER TABLE … ADD statement has a DEFAULT parameter. You can modify previous code like this:
if not (exists(SELECT * FROM SYSCOLUMNS WHERE ID = OBJECT_ID('[dbo].[MY_TABLE]') AND Name = 'NEW_COLUMN'))
BEGIN
ALTER TABLE [dbo].[MY_TABLE] ADD [NEW_COLUMN] [int] NULL DEFAULT 1 WITH VALUES
END
This ALTER statement assigns default value of 1 to the new column. WITH VALUES parameter is important, it populates existing rows with the default value (without it it will be populated by NULLs).
If you open an IE Modal Dialog window and later on need to resize it using JavaScript code, standard “window.resizeTo” method doesn’t work. Use dialogWidth and dialogHeight instead. For example:
Last year I described a way to display accurate row count when grid in OutlookGroupBy mode has multiple sub-groups.
That solution requires custom counting function. Fortunately to display aggregates such as SUM, AVG, MIN and MAX UltraWebGrid has a built-in functionality in form of GroupByRowDescriptionMaskDefault property of DisplayLayout. It specifies the string to be displayed in every GroupBy row and can include following substitutes:
[caption] – will display GroupBy column header text
[value] – will display common to the group cell value
[count] – will display row count (does not work correctly with sub-groups)
[avg], [sum], [min], [max] – will display the aggregate for the column it’s grouped by
[avg:ColumnKey], [sum:ColumnKey], [min:ColumnKey], [max:ColumnKey] – will display the aggregate for any other column, where ColumnKey is the key of the column
With this in mind in just a few simple steps we can make UltraWebGrid to display something like this:
In IE6/7 if you open 2 independent browsers (not using “New Window” or “New Tab”) they do not share common session and you can login to, let’s say, a web mail account under 2 different users at the same time.
This is not the case with IE8. Using 2 browser (and seeing 2 “iexplore.exe” processes in task manager) if you try to login as 2 users – the second will take over the first. I guess it’s a new “feature” of the browser.
But IE8 gives you a way out, albeit not obvious one. In menu, you can select File -> New Session. This will open a new browser window with independent session.