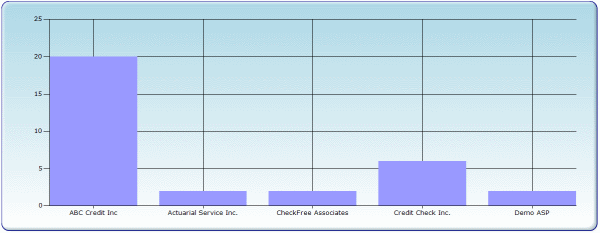
Often, when drawing a chart, there’s a need to show a threshold – basically a line that indicates whether your values are going above or below it. Take for example this ColumnChart:

Let’s say we need to show a threshold for the value of 7. Here’s how.
MSChart API supports several Annotation objects, we’re interested in HorizontalLineAnnotation. Take a look at the following code:
Dim oHla As New HorizontalLineAnnotation()

With oHla

    .AxisX = xmsChart.ChartAreas(0).AxisX
    .AxisY = xmsChart.ChartAreas(0).AxisY
    .ClipToChartArea = xmsChart.ChartAreas(0).Name
    .IsInfinitive = True

    .AnchorY = 7
    .LineWidth = 3
    .LineColor = Drawing.Color.Red
    .LineDashStyle = ChartDashStyle.Dot

End With

xmsChart.Annotations.Add(oHla)
- Line 1 creates HorizontalLineAnnotation object
- Lines 5, 6, 7 assocciate the annotation with chart area
- Line 8 makes sure that annotation line stretches thru entire chart
- Line 10 assigns our threshold value
- Lines 11, 12, 13 set the style of the annotation line
- Line 17 adds annotation we created to the chart
The result:


Many thanks. You’ve saved my life. I was trying to draw lines over my bar chart for last two days!