Category Archives: Infragistics

WebHierarchicalDataGrid: Locate cell by column name

If you need to get/set value of a specific cell in WHDG Row (which is of GridRecord or ContainerGridRecord type) the only way to do it is by Cell index e.g.

Protected Sub xMyGrid_InitializeRow(ByVal sender As Object, ByVal e As GridControls.RowEventArgs) Handles xMyGrid.InitializeRow
   e.Row.Items(15).Value = 42
End Sub

But what if you don’t know cell/column index and only column name is known? Then the trick is to find the index first. Consider following code:

Protected Sub xMyGrid_InitializeRow(ByVal sender As Object, ByVal e As GridControls.RowEventArgs) Handles xMyGrid.InitializeRow

   Dim oParent as GridControls.ContainerGrid = e.Row.Items.Grid
   Dim iColIndex as Integer

   if oParent.Columns("MY_COLUMN_NAME") IsNot Nothing
      iColIndex = oParent.Columns("MY_COLUMN_NAME").Index
      e.Row.Items(iColIndex).Value = 42
   End If

End Sub

It’s pretty straightforward, first you locate grid to which the row belongs, then locate column in that grid by name and get index of that column and finally locate cell in the row by that index. This method will work at any depth in the WHDG hierarchy.

Making HoverCssClass work in WebDataTree

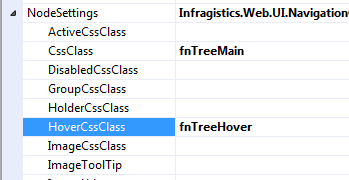
Infragistics WebDataTree control offers extensive support of CSS for tree styling. One of the options HoverCssClass is intended to alter tree node appearance when mouse pointer hovers over it:

HoverCssClass properting in Infragistics WebDataTree

Unfortunately it doesn’t seem to have any effect on the tree appearance. When I set that class to simple underline node:

.fnTreeHover {text-decoration:underline}

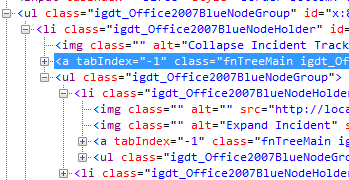
nothing happened. I found the workaround when I noticed that the tree is rendered as an ancor tag <A> inside of <LI> tag:

WebDataGrid rendered in HTML

The solution is to apply style to this combination:

LI A:hover {text-decoration:underline}

Bingo. Now tree nodes are underlying when mouse is over them.

UltraWebGrid: Hiding ServerOnly columns during export to Excel

If you’re using Infragistics UltraWebGrid with ExcelExporter and your grid has columns marked as “ServerOnly” – they’re visible in exported Excel worksheet even though the grid doesn’t show them onscreen. To hide these column in exported file, mark them as “Hidden” as well. This will have no additional effect on the way grid looks on screen, but the columns will be gone from the worksheet.

UltraWebGrid: Set filter icon when manually handling RowFilterApplying event

If you’re using Infragistics UltraWebGrid and manually handling grid’s RowFilterApplying event by doing your own filtering/querying and then canceling the event by setting parameter e.Cancel = True, one of the side-effects is that column filter icon never changes to “applied” image.

To work around this limitation you need to change the image yourself. This involves 2 steps:

1st step – In the server side, code in RowFilterApplying event handler loops thru filtered columns, getting column index, filtered state and calling a JavaScript function that would actually set the image:

Protected Sub xmyGrid_RowFilterApplying(ByVal sender As Object, ByVal e As UltraWebGrid.FilterEventArgs) Handles xmyGrid.RowFilterApplying

    ' ... Your own filtering/querying code

    Dim xGrid As UltraWebGrid = sender

    For Each oFilter As ColumnFilter In xGrid.Rows.ColumnFilters
         If oFilter.FilterConditions.Count = 0 OrElse oFilter.FilterConditions(0).ComparisonOperator = FilterComparisionOperator.All Then
            RunJavascript(Me, "setFilterIcon(" & oFilter.Column.Index & ", 'MyImages/ig_tblFilter.gif');")
         Else
            RunJavascript(Me, "setFilterIcon(" & oFilter.Column.Index & ", 'MyImages/ig_tblFilterApplied.gif');")
         End If
    Next

    e.Cancel = True

End Sub

During the loop code double checks if filter is applied to current column and if so passes URL of “applied” filter image to the JavaScript function – in this case “MyImages/ig_tblFilterApplied.gif”. Otherwise URL of “empty” filter is passed – in this case “MyImages/ig_tblFilter.gif”. To generate JavaScript call from ASP.NET code I am using RunJavascript function which works correctly both on normal postback and Infragistics partial postback (read WARP panel).

2nd step – And here’s JavaScript function that sets the image:

// Set's filter icon of the specifiec column
function setFilterIcon(i_iColumnIndex, i_sFilterImageURL) {
    var sThId = igtbl_getGridById('xmyGrid').Bands[0].Columns[i_iColumnIndex].Element.id; 
    document.getElementById(sThId).firstChild.lastChild.src = i_sFilterImageURL
}

Using passed in column index, code locates column object and its DOM “TH” element (note: You have to get an ID of the element first, and then locate element by calling document.getElementById, using Column.Element for some reason returns an empty TH tag). Once element is located, code locates filter image inside and sets its source to passed image URL

WebHierarchicalDataGrid: Helpful client functions for row selection

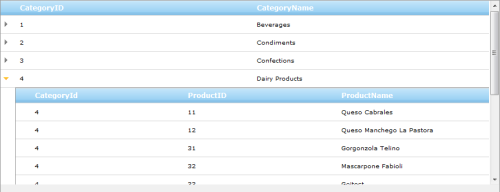
Working with row selection in Infragistics WebHierarchicalDataGrid can be complicated since it maintains independent row selection collection for each row island and basic operations (select/unselect) aren’t that obvious. I put together a few functions to make it a little bit easier.

This first function is very basic, it returns total count of selected rows across all expanded row islands, no matter what depth. The key here is get_selectedRowsResolved() method of Selection behavior which returns an array of all selected rows:

// Returns number of selected rows from all rowislands in WebHiearchicalDataGrid
// i_oGrid: Infragistics WebHiearchicalDataGrid object
function selRowsCount(i_oGrid) {
    return  i_oGrid.get_gridView().get_behaviors().get_selection().get_selectedRowsResolved().length 
}

The following function loops thru all selected rows, collecting values from specific column (useful for example for collecting IDs of selected rows). It accepts 3 parameters – WebHiearchicalDataGrid object, column key and separator character and returns a string in which selected values are separated by that character (if nothing is passed – default separator is comma). Continue reading →

Infragistics WebDataMenu CSOM addItem/removeItem workaround

Infragistics Aikido WebDataMenu control has extensive (albeit poorly documented) client-side library of classes, method and properties. 2 methods addItem and removeItem supposedly allow you to add/remove menu items in JavaScript. These methods have been public since 9.2 release probably even earlier, but have a lot of drawbacks, one of the major ones – for every method call an AJAX call to server is made, which slows performance dramatically, breaks code flow and won’t let you set properties of newly added item.

Method described below is a bit of a hack, but it works purely client-side, no slow round trips, no waiting for AJAX call to return and you have full control of all menu items. Continue reading →

If HtmlEncode doesn’t work for WebDataGrid…

While working with Infragistics WebDataGrid/WebHierarchicalDataGrid I noticed a strange thing: column’s HtmlEncode property (which should control whether HTML value of grid’s cell is rendered as HTML or shown as is in raw tags) had no effect. Maybe I was doing something wrong, maybe it was the fact that grid columns were generated in server-side code (here is short snippet):

oGridCol = New GridControls.BoundDataField()
oGridCol.DataFieldName = sDataColName
oGridCol.Header.Text = sCaption
oGridCol.Key = sKey

if '(some condition) then
   oGridCol.HtmlEncode = False
   oGridCol.CssClass = "nowrapHTML"
Else
   oGridCol.HtmlEncode = True
   oGridCol.CssClass = "nowrapPLAIN"
End If

Here if a certain condition is met – column should render HTML (HtmlEncode = False) otherwise it should display HTML tags (HtmlEncode = True). To make cell expand to data width, 2 simple CSS classes were used:

.nowrapHTML {white-space:nowrap}
.nowrapPLAIN {white-space:pre}

In following grid first column was being set with HtmlEncode = True, second with HtmlEncode = False, yet both columns were rendered as HTML.

HtmlEncode doesn't work

Continue reading →

Improved Auto-size columns for Infragistics WebHierarchicalDataGrid

In the previous post I described a method to automatically resize columns for Infragistics grid control. It works (most of the times) for flat WebDataGrid, but if you try same approach with WebHierarchicalDataGrid – it will fail for child bands.

Lets review what we’re trying to accomplish. A grid column should automatically resize to whichever is wider: either size of widest data in a column cell, or size of column header’s caption.

First is accomplished by not setting column width explicitly and by setting white-space attribute of cell’s style to nowrap. It can be done by either opening grid CSS class file located at ~/ig_res/[Your Style Name]/ig_dataGrid.css, locate tbody.igg_[Your Style Name]Item>tr>td class and add one more line at the end: white-space:nowrap. Here is an example with Office 2007 Style:

tbody.igg_Office2007BlueItem>tr>td
{
	background-color:White;
	border-right:solid 1px #D0D7E5;
	border-bottom:solid 1px #D0D7E5;
	padding:2px 5px 2px 5px;
	height: 18px;
	overflow: hidden;
	text-align:left;
	vertical-align:middle;
	white-space:nowrap;
}

Or (if you don’t want to touch original style) same can be achieved by *CssClass properties exposed by the grid.

Second (resizing column to header’s caption width, if it is wider then cells’ data) is a bit tricker. Continue reading →

WebHierarchicalDataGrid: Manual Load on Demand when bound to DataSet

Even though I have my issues with Infragistics WebHierarchicalDataGrid control, it has some neat features and I found that with some tweaks you can make it work.

Case in point: Manual Load on Demand. If you have hierarchical data structure, it allows you to retrieve only root level data and then when user clicks “Expand” arrow – get additional data on as needed basis:

Manual Load on Demand in action

This is achieved by handling RowIslandsPopulating grid’s event in which you can run a DB query based on parent row data, then manually create a ContainerGrid object bind it to the data and add it to parent row RowIslands collection:

Protected Sub myGrid_RowIslandsPopulating(ByVal sender As Object, ByVal e As ContainerRowCancelEventArgs) Handles myGrid_.RowIslandsPopulating

     e.Cancel = True

     Dim oData as SomeDataType = GetData()
     Dim oChildGrid As New ContainerGrid()

     e.Row.RowIslands.Add(oChildGrid)

     oChildGrid.DataKeyFields = "SOME_ID"
     oChildGrid.Level = e.Row.Level + 1
     oChildGrid.DataSource = oData
     oChildGrid.DataBind()

End Sub

For this approach to work top-level rows need to display “Expand” arrows that user can click. Continue reading →

Auto-size columns in Infragistics WebDataGrid

Ever wished your WebDataGrid could have Table Layout = Auto like old UltraWebGrid? Then it could automatically resize columns width to data width with respect line breaks. Well, it can, and in style (pan intended). Thanks to Infragistics tech-support for starting me in the right direction – here’s first 2 steps that need to be taken:

  1. Don’t set column width property – either default or for specific column either in server-side code or declaratively and don’t set grid’s width property
  2. Open your grid CSS class file, it’s located at ~/ig_res/[Your Style Name]/ig_dataGrid.css.
    Locate tbody.igg_[Your Style Name]Item>tr>td class and add one more line at the end: white-space:nowrap. Here is an example with Office 2007 Style:

    tbody.igg_Office2007BlueItem>tr>td
    {
    	background-color:White;
    	border-right:solid 1px #D0D7E5;
    	border-bottom:solid 1px #D0D7E5;
    	padding:2px 5px 2px 5px;
    	height: 18px;
    	overflow: hidden;
    	text-align:left;
    	vertical-align:middle;
    	white-space:nowrap;
    }

Run your project – you will get a nicely autoresized grid columns:

WebDataGrid with autosized columns

But there’s one problem with this approach. Continue reading →