Tag Archives: extending

TNX Text Links Ads: How to automatically fill all your ad spots (including pages with 0 PR) and other tricks

TNX Corp allows you to place static ad links on pages of your site, so you can earn some profit. Unfortunately if you leave it to TNX system, automatic rate at which links are sold and paced on your site could be very slow. You can add links to your pages manually via TNX site interface, but it is only allowed if your page Google PageRank is above 0. Also manual placement can be really inconvenient and you cannot place more than 4 ad links.

Fortunately there is a solution. Continue reading →

UltraWebGrid in OutlookGroupBy Mode: How to display custom aggregates (SUM, AVG, MIN, MAX) in GroupBy row

Last year I described a way to display accurate row count when grid in OutlookGroupBy mode has multiple sub-groups.

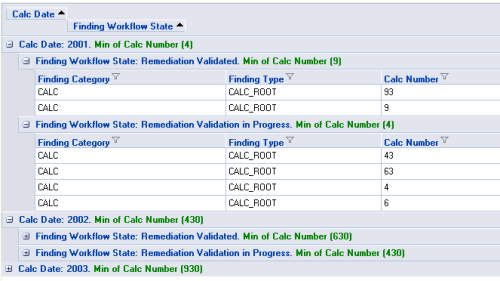
That solution requires custom counting function. Fortunately to display aggregates such as SUM, AVG, MIN and MAX UltraWebGrid has a built-in functionality in form of GroupByRowDescriptionMaskDefault property of DisplayLayout. It specifies the string to be displayed in every GroupBy row and can include following substitutes:

  • [caption] – will display GroupBy column header text
  • [value] – will display common to the group cell value
  • [count] – will display row count (does not work correctly with sub-groups)
  • [avg], [sum], [min], [max] – will display the aggregate for the column it’s grouped by
  • [avg:ColumnKey], [sum:ColumnKey], [min:ColumnKey], [max:ColumnKey] – will display the aggregate for any other column, where ColumnKey is the key of the column

With this in mind in just a few simple steps we can make UltraWebGrid to display something like this:


Continue reading →

Global Chart Type for Dundas Chart Control

      Dundas Charts for .NET has many cool features like async callbacks, AJAX scroll and zoom, plenty of chart types and great visuals, but in some cases some of those features could turn out to be more of a burden than useful. One example – the ability to set chart type for each individual series of a chart. This offers great flexibility in building combination charts (you can display column and line on the same chart to reflect different series’ data), but you’re losing the Infragistics simplicity of just setting the chart type and binding chart to data without worrying about appearance of each individual series.
      This is especially inconvinient if you load chart appearance (including series appearance and chart type) from an external template. If you want to use chart type from the template, but feed it your own data – you’re stuck.  But there is a solution. Continue reading →
ASP.NET accessing session variables in class modules

Sessions are a great way to share variable across your entire application, but they’re not accessable directly in class modules since they’re outside of page scope. So if you try something like Session(“VariableName”) = value  inside of your class, you will get an error.

Fortunately there is a way.  Thru HttpContext.Current notation available such common properties as Session, Server, Application, Cache. So to access your session variable inside a class just use HttpContext.Current.Session(“VariableName”) = value

UltraWebGrid in OutlookGroupBy Mode: How to count total number of rows in subgroups

Infragistics UltraWebGrid has a nice feature – OutlookGroupBy mode – which allows to group rows by common field either by dragging them into a GroupBy Box or programmatically.

The only drawback – when you have several levels of groupings (group within a group) – the outer group shows count of inner groups, not total number of individual rows within a group.

before

When I contacted Infragistics tech support asking how to show total count of rows within a group they told me it was impossible. Well, turned out it wasn’t entirely true.

Continue reading →