
FusionCharts states in their documentation that in Bubble and Scatter Charts both X-Axis and Y-Axis must be numeric. But what if you want X-Axis to display some names or dates or other non-numeric values? That is still possible via label attribute of chart’s categories element.
The method below utilizes ADO.NET/VB.NET to build XML for chart data, but similar approach can be easily used in other languages/technologies.
Consider the following ADO.NET DataTable, called dtChartData:
               Login Failure  Login Success
-------------- -------------- -------------
2013-03-27     1              69
2013-03-26     0              32
2013-03-25     1              86
2013-03-22     0              11
It holds data for number of successful/unsucessful logins for a given date. We want to display this data as a Bubble chart with dates displayed on X-Axis.
Take a look at the following code snippet:
Dim sbXmlChartSeriesData As New StringBuilder

sbXmlChartSeriesData.Append("<categories>")

'Looping thru the first column, creating categories and X-Axis labels and values
For J As Integer = 0 To dtChartData.Rows.Count - 1
   sbXmlChartSeriesData.AppendFormat("<category label='{0}' x='{1}' showVerticalLine='1' />", dtChartData.Rows(J)(0)), J + 1)
Next

sbXmlChartSeriesData.Append("</categories>")

'Datasets - from the rest of the columns row by row
For I As Integer = 1 To dtChartData.Columns.Count - 1
   sbXmlChartSeriesData.AppendFormat("<dataset seriesName='{0}' >", dtChartData.Columns(I).ColumnName)

   For J As Integer = 0 To dtChartData.Rows.Count - 1
      sbXmlChartSeriesData.AppendFormat("<set y='{0}' x='{1}' ", dtChartData.Rows(J)(I), J + 1)
      sbXmlChartSeriesData.AppendFormat("z='{0}' ", i_dtChartData.Rows(J)(I))
      sbXmlChartSeriesData.Append("/>")
   Next

   sbXmlChartSeriesData.Append("</dataset>")
Next
Here we’re using a StringBuilder object to effectively build string with XML data
Lines 3-10 Build categories section of XML data. Note Line 7 -we use 1st column data (that contains dates) as a category label – that value will be displayed on the X-Axis. For a mandatory numeric X value we use row index, but that value will never be displayed since it will be overwritten by labels.
Lines 12-23 build dataset sections of the XML file. DataTable’s Column name is used for Series name (Line 14). Line 17 sets Y value to actual column value for current row and X value again to row index to match the X in the Categories section. Note Line 18: For Bubble chart this example reuses Y value for Z value (so the higher up Y-Axis the bubble, the bigger its radius will be), but you’re free to modify it to suit your requirements.
This code produces nice XML data that you can plug into your chart’s main XML:
<categories>
   <category label='2013-03-27' x='1' showVerticalLine='1' />
   <category label='2013-03-26' x='2' showVerticalLine='1' />
   <category label='2013-03-25' x='3' showVerticalLine='1' />
   <category label='2013-03-22' x='4' showVerticalLine='1' />
</categories>

<dataset seriesName='Login Failure' >
   <set y='1' x='1' z='1' />
   <set y='0' x='2' z='0' />
   <set y='1' x='3' z='1' />
   <set y='0' x='4' z='0' />
</dataset>

<dataset seriesName='Login Success' >
   <set y='69' x='1' z='69' />
   <set y='32' x='2' z='32' />
   <set y='86' x='3' z='86' />
   <set y='11' x='4' z='11' />
</dataset>
After adding attributes to main chart element to limit X-Axis values to xAxisMinValue='0' and xAxisMaxValue='" & dtChartData.Rows.Count + 1 & "'" – a beautiful chart is produced:
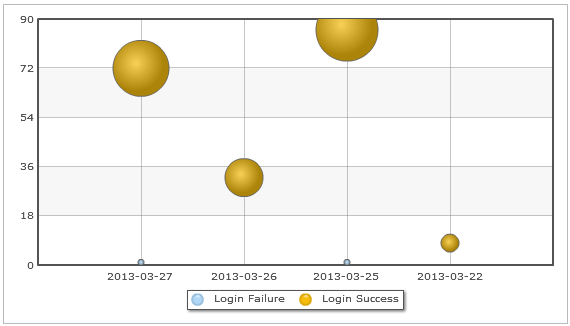
With X-Axis displaying non-numeric data – in this case dates.