Category Archives: VB.NET

FusionCharts: Use non-numeric Xaxis in Bubble and Scatter Charts

FusionCharts states in their documentation that in Bubble and Scatter Charts both X-Axis and Y-Axis must be numeric. But what if you want X-Axis to display some names or dates or other non-numeric values? That is still possible via label attribute of chart’s categories element.

The method below utilizes ADO.NET/VB.NET to build XML for chart data, but similar approach can be easily used in other languages/technologies.

Consider the following ADO.NET DataTable, called dtChartData:

               Login Failure  Login Success
-------------- -------------- -------------
2013-03-27     1              69
2013-03-26     0              32
2013-03-25     1              86
2013-03-22     0              11

It holds data for number of successful/unsucessful logins for a given date. We want to display this data as a Bubble chart with dates displayed on X-Axis. Continue reading →

Norton 360 Provides Security, Identity Protection, PC Tune-up, and More

Are you looking to secure your computer from the infectious viruses lurking on the Internet? Are you interested in getting your PC running as fast as possible? Are you hoping to protect your identity and keep your personal information safe from intruders and scammers who will stop at anything to steal it? If so, Norton 360 has everything you are looking. Norton 360 is the all-in-one security protection software produced by Symantec that works around the clock to protect not only your computer, but you, from potential security breaches that can happen without you having the slightest idea.

Norton 360 has been updated to find and kill the most serious viruses, implementing a five layer protection system that discovers and terminates threats faster than competing software. The threat removal layer digs deep into the confines of your system to get rid of treacherous threats and viruses, while the network defense layer works to stop threats before they can even reach your system. Meanwhile, SONAR technology and constant threat monitoring keep your system in-check and monitored at all times, so that threats that have reached your computer can be detected and put to rest before the effects become noticeable and threats that exist online are weeded out from web searches and search engines, disallowing you from finding them and reaping the consequences that can occur.

While all of this is going on quietly in the background of your computer, Norton 360 is keeping your personal information guarded and your files organized, fixing any other problems that may be occurring and compressing data to keep your system running lightning fast. The security suite can be installed on up to three computers and/or devices, with cloud management controlling all devices from a single, central unit. Norton 360 users also have the option of backing up and restoring files (documents, music, videos, photos, etc.), installing parental controls, scanning and updating at all times of the day, and so much more. Norton 360 has so much to offer to all its customers. If you haven’t yet purchased a subscription, what are you waiting for?

Solution: eventArgs.get_type() incorrectly detects header of WebDataGrid in FireFox as cell

If you use CSOM of Infragistics WebDataGrid you may encounter a bug in client-side event handlers. Let’s say some action is needed on double clicking of a grid cell. The handler looks something like this:

function xMyGrid_DoubleClick(sender, eventArgs) {
   if (eventArgs.get_type() == "cell") {
      //perform action
   }
}

IF condition on line 2 makes sure that action is executed only if actual grid cell is double clicked. If you double click column header, eventArgs.get_type() would return "header" and the action would be skipped.

But not in FireFox. In that browser eventArgs.get_type() returns "cell" even when header is clicked. So an additional condition is needed. Grid column header is rendered as a TH HTML element and this is what we can check:

function xMyGrid_DoubleClick(sender, eventArgs) {
   if (eventArgs.get_type() == "cell" &&  eventArgs.get_item().get_element().tagName != 'TH') {
      //perform action
   }
}

This solution works universally in all browsers.

Solution for Infragistics WebDataGrid filtering error “Length cannot be less than zero”

Infragistics WebDataGrid/WHDG controls for ASP.NET offer nice filtering features. Out of the box you just have to enable the behavior and badabingo:

WebDataGrid filtering

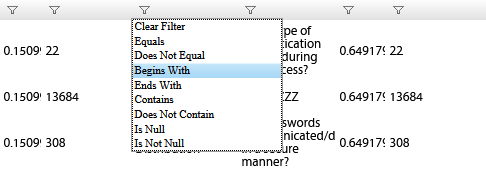
There is one glitch though in the way text filtering is implemented: If you enter an empty string as a filter value – an error is thrown:

Async refresh failed. Length cannot be less than zero

Apparently internal grid code cannot handle empty strings (as of version 12.2) so we have to take matter in our own hands.
Continue reading →

FusionCharts.RenderChart and ASP.NET UpdatePanel

Fusion Charts

FusionCharts is a very cool cross-platform charting library – it offers huge variety of chart types and mind-blowing special effects. It also offers wide variety of chart rendering options both client- and server-side.

One such option is to render chart in an ASP.NET application. FusionCharts.dll that you get with the package offers handy FusionCharts.RenderChart method that generates all the client-side code you need to display a beautiful chart. Usually it is used something like this:

xLabel1.text = FusionCharts.RenderChart("FusionCharts/Pie2D.swf", "", sChartXmlData, sChartID, iChartWidth, iChartHeight, False, True)

where xLabel1 is a Label or Literal control in your ASPX page and FusionCharts.RenderChart is a function that accepts number of parameters, like chart type, chart XML data, dimensions etc.

It works very well until you want to render the chart inside of Microsoft Ajax UpdatePanel – then nothing works. This happens because FusionCharts.RenderChart function emits some HTML along with JavaScript that do not work during partial postback. FusionCharts suggest hooking up to UpdatePanel life-cycle events, but it’s seems like an overkill, and often doesn’t work (especially if you have a complex project, which this hookup can interfere with). But there’s an alternative solution.
Continue reading →

Infragistics WebDataMenu last item disappears

While using Infragistics WebDataMenu control from their NetAdvantage for ASP.NET Suite (version 2012.2, current as of this post) I noticed that last menu item in horizontal menu disappears. To me this only happened in Firefox.

Disappearing Act

This post suggested to set EnableScrolling menu property to False as a solution. Which is fine and well, but did not work for me since I need my menu to scroll (it has limited width available and menu items are added programmatically in code-behind so total items width can be wider than width available for the menu).

Continue reading →

Infragistics WebDataGrid: Hidden columns become visible after AJAX postback

A recent update to .NetAdvantage for ASP.NET v12.2 introduced a weird bug – hidden columns of WebDataGrid and WHDG become visible after postback. Service release 12.2.20122.2031 fixed that issue – but only for full postback. Under some circumstances if grid performs an AJAX call (sorting, paging etc.) hidden columns become visible again. This does not happen in IE, but other browsers, such as Chrome and FireFox do exhibit the issue.

This is happening because hidden columns lose “display:none” property in their style. If this happens to you – you have to take matter in your own hands. Continue reading →

Infragistics WebDataMenu: Enable client-side resize with scrolling

Infragistics WebDataMenu control for ASP.NET has a neat feature: if items for horizontal menu don’t fit in allocated width – it automatically adds scroll buttons:

Scrolling in WebDataMenu

Unfortunately this works only if you set menu width in ASPX markup or server-side code. But what if menu is built dynamically and you don’t know in advance how many items there will be. Or if user resizes browser window and available width changes?

We need to be able to set menu width in client-side JavaScript code. Also we need to check whether all items fit into menu width and if not – enable scroll buttons – on demand. The code below does just that. Continue reading →

Solution for: Value of type ‘System.Web.UI.HtmlControls.HtmlGenericControl’ cannot be converted to ‘System.Web.UI.HtmlControls.HtmlTableRow’ error

If you’re trying to compile an ASP.NET project/website in Visual studio 2012 or 2010 and getting error:

Value of type ‘System.Web.UI.HtmlControls.HtmlGenericControl’ cannot be converted to ‘System.Web.UI.HtmlControls.HtmlTableRow’

chances are you have an HTML table in your ASPX markup with runat="server" attribute set and <tbody> or <thead> tags present. Remove <tbody> and <thead> tags and the error should go away.

WebDataTree: Use custom images for Expand/Collapse

Infragistics WebDataTree control offers variety of styles via supplied StyleSets and each StyleSet has its own Expand/Collapse images for tree branches. Unfortunately the control doesn’t offer built-in way to use your own expand/collapse images, to achieve that you need to replace respective images in the StyleSet currently used by the tree.

But if you’re reluctant to go this way for whatever reason (you’re using your own style or don’t want to change canonical Infragistics style) there’s another way – purely client-side JavaScript.

Note: The method below assumes that all the levels the tree are fully rendered on the client. If you’re employing load-on-demand, the method will require some adjustments.

Place the code below in Tree client-side Init event:

function xwdTree_Init(sender, eventArgs) {
   /// <summary>
   /// Fires when tree is initialized
   /// </summary>

   //{******* Replacing Expand/Collapse images in the tree with custom ones

   // Looping thru images in the tree itself
   var aTreeImages = sender.get_element().getElementsByTagName('img');
   
   for (I = 0; I < aTreeImages.length; I++) {
      if (aTreeImages[I].src.indexOf('Plus') != -1) aTreeImages[I].src = 'images/my_expand.png'
      else if (aTreeImages[I].src.indexOf('Minus') != -1) aTreeImages[I].src = 'images/my_collapse.png'
   }

   // Looping thru images in hidden div used for replacement after click
   var aTreeActionImages = $get(sender.get_id() + '_Images').getElementsByTagName('img');
   
   for (I = 0; I < aTreeActionImages.length; I++) {
      if (aTreeActionImages[I].src.indexOf('Plus') != -1) aTreeActionImages[I].src = 'images/my_expand.png'
      else if (aTreeActionImages[I].src.indexOf('Minus') != -1) aTreeActionImages[I].src = 'images/my_collapse.png'
   }

   //******* Replacing Expand/Collapse images in the tree with custom ones }
        
}

Take a look at Lines 8-14. This code locates Tree control and its respective DOM element. Then it loops thru all the images inside. If it’s an “expand” image (has the word “plus” in its name) – we replace it with our custom expand image. If a tree node already rendered expanded – the code will locate “collapse” image (which has the word “minus” in its name).

This is all good and well for currently rendered nodes. But when you start expand and collapse nodes – images are replaced dynamically (“expand” becomes “collapse” when node is expanded and vice-versa) by Infragistics code. If you only execute code in Lines 8-14 and then expand or collapse tree nodes – your images will get replaced with Infragistics original ones from their secret repository.

Fortunately that secret repository is a plain hidden DIV with the ID “yourTreeID_Images”. Take a look at Lines 16-22. This code locates the DIV that holds replacement images and replaces them with our own similarly to Lines 8-14. After it ran, when Infragistics code needs to grab an image to replace expand/collapse one – it will get yours.

As a result Tree is rendered (both statically and dynamically) with your own beautiful images.