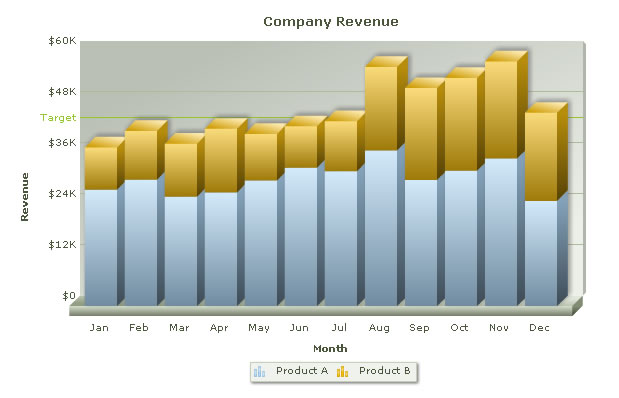
FusionCharts is a very cool cross-platform charting library – it offers huge variety of chart types and mind-blowing special effects. It also offers wide variety of chart rendering options both client- and server-side.
One such option is to render chart in an ASP.NET application. FusionCharts.dll that you get with the package offers handy FusionCharts.RenderChart method that generates all the client-side code you need to display a beautiful chart. Usually it is used something like this:
xLabel1.text = FusionCharts.RenderChart("FusionCharts/Pie2D.swf", "", sChartXmlData, sChartID, iChartWidth, iChartHeight, False, True)
where xLabel1 is a Label or Literal control in your ASPX page and FusionCharts.RenderChart is a function that accepts number of parameters, like chart type, chart XML data, dimensions etc.
It works very well until you want to render the chart inside of Microsoft Ajax UpdatePanel – then nothing works. This happens because FusionCharts.RenderChart function emits some HTML along with JavaScript that do not work during partial postback. FusionCharts suggest hooking up to UpdatePanel life-cycle events, but it’s seems like an overkill, and often doesn’t work (especially if you have a complex project, which this hookup can interfere with). But there’s an alternative solution.
Continue reading →

