Category Archives: Javascript

FusionCharts: Invalid Data when using javascript renderer (solved)

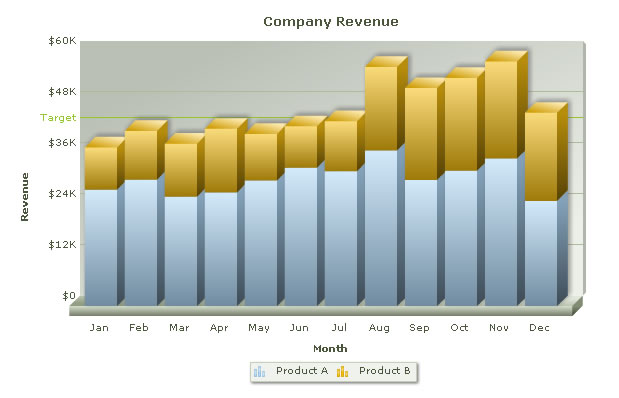
If you’re using FusionCharts you may encounter a strange issue – chart renders correctly when Flash renderer is in use and displays “Invalid Data” error message when falling back (or forced) to JavaScript renderer.

In most cases culprit is invalid XML data passed to the engine. And while Flash is more forgiving, JavaScript requires strict valid XML. Most often the cause for the issue are characters invalid in XML. Check your data and if they contain following characters – replace them with their encoded values:

" (quote) --> "
' (apostrophe) --> '
< (less sign) --> &lt;
> (greater sign) --> &gt;
& (ampersand)  --> &amp;

And the error will disappear.

Happy charting!

Infragistics WebTab: Simulating SelectedIndexChanging event when programmaticaly changing tabs via set_selectedIndex

Infragistics WebTab control is very versatile and offers rich server- and client-side model. Among client-side events are

  • SelectedIndexChanged – fires after user has changed the tab to provide ways to interact with newly selected tab
  • SelectedIndexChanging – fires before user has changed the tab to provide ways to interact with currently selected tab and to give user a chance to cancel change.

Both work fine if user manually changes tabs by clicking on tab headers, but call to client-side set_selectedIndex() function (which changes tabs programmaticaly) only fires SelectedIndexChanged, skipping SelectedIndexChanging altogether. But there’s a way to make it work.
Continue reading →

Solution: eventArgs.get_type() incorrectly detects header of WebDataGrid in FireFox as cell

If you use CSOM of Infragistics WebDataGrid you may encounter a bug in client-side event handlers. Let’s say some action is needed on double clicking of a grid cell. The handler looks something like this:

function xMyGrid_DoubleClick(sender, eventArgs) {
   if (eventArgs.get_type() == "cell") {
      //perform action
   }
}

IF condition on line 2 makes sure that action is executed only if actual grid cell is double clicked. If you double click column header, eventArgs.get_type() would return "header" and the action would be skipped.

But not in FireFox. In that browser eventArgs.get_type() returns "cell" even when header is clicked. So an additional condition is needed. Grid column header is rendered as a TH HTML element and this is what we can check:

function xMyGrid_DoubleClick(sender, eventArgs) {
   if (eventArgs.get_type() == "cell" &&  eventArgs.get_item().get_element().tagName != 'TH') {
      //perform action
   }
}

This solution works universally in all browsers.

Implement “onVisible” event for HTML DOM element in JavaScript

Well, not exactly, but method described in this particular scenario can be expanded to other cases. Imagine you have a clickable element, let’s say a SPAN and when user clicks this element – it is covered by an absolutely positioned DIV with a higher z-index. In other words a dialog is displayed:

<span onclick="showDialogDiv()">Click here</span>

When user closes the dialog – your SPAN needs to detect this event, to perform some functions (refresh data on the page etc.) but you have no control over function that closes the DIV, so you can’t hook into it. All you know is that DIV’s display style is set to “none” when this happens. It would be cool if there was an “onvisible” event so you could do something like

<span onclick="showDialogDiv()" onvisible="performAction()">Click here</span>

but there’s no such event, so we need to simulate it. Which is surprisingly easy:

<span onclick="showDialogDiv(); var i=setInterval(function(){if ($('xdivDialog').style.display=="none") {clearInterval(i);performAction()}},1000)">Click here</span>

Basically when user clicks the SPAN to show the dialog – at the same time a timer is started that regularly checks visibility of the dialog DIV (whether it’s style display became “none” again). Once this is detected, that means opener SPAN is visible again – timer is stopped and function to handle event is called.

FusionCharts.RenderChart and ASP.NET UpdatePanel

Fusion Charts

FusionCharts is a very cool cross-platform charting library – it offers huge variety of chart types and mind-blowing special effects. It also offers wide variety of chart rendering options both client- and server-side.

One such option is to render chart in an ASP.NET application. FusionCharts.dll that you get with the package offers handy FusionCharts.RenderChart method that generates all the client-side code you need to display a beautiful chart. Usually it is used something like this:

xLabel1.text = FusionCharts.RenderChart("FusionCharts/Pie2D.swf", "", sChartXmlData, sChartID, iChartWidth, iChartHeight, False, True)

where xLabel1 is a Label or Literal control in your ASPX page and FusionCharts.RenderChart is a function that accepts number of parameters, like chart type, chart XML data, dimensions etc.

It works very well until you want to render the chart inside of Microsoft Ajax UpdatePanel – then nothing works. This happens because FusionCharts.RenderChart function emits some HTML along with JavaScript that do not work during partial postback. FusionCharts suggest hooking up to UpdatePanel life-cycle events, but it’s seems like an overkill, and often doesn’t work (especially if you have a complex project, which this hookup can interfere with). But there’s an alternative solution.
Continue reading →

Infragistics WebDataMenu: Enable client-side resize with scrolling

Infragistics WebDataMenu control for ASP.NET has a neat feature: if items for horizontal menu don’t fit in allocated width – it automatically adds scroll buttons:

Scrolling in WebDataMenu

Unfortunately this works only if you set menu width in ASPX markup or server-side code. But what if menu is built dynamically and you don’t know in advance how many items there will be. Or if user resizes browser window and available width changes?

We need to be able to set menu width in client-side JavaScript code. Also we need to check whether all items fit into menu width and if not – enable scroll buttons – on demand. The code below does just that. Continue reading →

WebDataTree: Use custom images for Expand/Collapse

Infragistics WebDataTree control offers variety of styles via supplied StyleSets and each StyleSet has its own Expand/Collapse images for tree branches. Unfortunately the control doesn’t offer built-in way to use your own expand/collapse images, to achieve that you need to replace respective images in the StyleSet currently used by the tree.

But if you’re reluctant to go this way for whatever reason (you’re using your own style or don’t want to change canonical Infragistics style) there’s another way – purely client-side JavaScript.

Note: The method below assumes that all the levels the tree are fully rendered on the client. If you’re employing load-on-demand, the method will require some adjustments.

Place the code below in Tree client-side Init event:

function xwdTree_Init(sender, eventArgs) {
   /// <summary>
   /// Fires when tree is initialized
   /// </summary>

   //{******* Replacing Expand/Collapse images in the tree with custom ones

   // Looping thru images in the tree itself
   var aTreeImages = sender.get_element().getElementsByTagName('img');
   
   for (I = 0; I < aTreeImages.length; I++) {
      if (aTreeImages[I].src.indexOf('Plus') != -1) aTreeImages[I].src = 'images/my_expand.png'
      else if (aTreeImages[I].src.indexOf('Minus') != -1) aTreeImages[I].src = 'images/my_collapse.png'
   }

   // Looping thru images in hidden div used for replacement after click
   var aTreeActionImages = $get(sender.get_id() + '_Images').getElementsByTagName('img');
   
   for (I = 0; I < aTreeActionImages.length; I++) {
      if (aTreeActionImages[I].src.indexOf('Plus') != -1) aTreeActionImages[I].src = 'images/my_expand.png'
      else if (aTreeActionImages[I].src.indexOf('Minus') != -1) aTreeActionImages[I].src = 'images/my_collapse.png'
   }

   //******* Replacing Expand/Collapse images in the tree with custom ones }
        
}

Take a look at Lines 8-14. This code locates Tree control and its respective DOM element. Then it loops thru all the images inside. If it’s an “expand” image (has the word “plus” in its name) – we replace it with our custom expand image. If a tree node already rendered expanded – the code will locate “collapse” image (which has the word “minus” in its name).

This is all good and well for currently rendered nodes. But when you start expand and collapse nodes – images are replaced dynamically (“expand” becomes “collapse” when node is expanded and vice-versa) by Infragistics code. If you only execute code in Lines 8-14 and then expand or collapse tree nodes – your images will get replaced with Infragistics original ones from their secret repository.

Fortunately that secret repository is a plain hidden DIV with the ID “yourTreeID_Images”. Take a look at Lines 16-22. This code locates the DIV that holds replacement images and replaces them with our own similarly to Lines 8-14. After it ran, when Infragistics code needs to grab an image to replace expand/collapse one – it will get yours.

As a result Tree is rendered (both statically and dynamically) with your own beautiful images.

WHDG: Position “Group by” area anywhere on the page

WebHierarchicalDataGrid grouping feature offers handy “Group By” area – a place where columns can be dragged to for grouping. It has one limitation though: by default it can be positioned only on top or the bottom of the grid. But what if you want to place it elsewhere? For example you have a dedicated navigation part of your page where you want to display grouped columns.

DOM to the rescue. As I mentioned in my previous post Group By area is a DIV that can be located by its CSS class name (either assigned by you or, barring that, class of a StyleSet used by the grid control). After the area is located, it can be moved to a location of your choice, for example another DIV by standard appendChild DOM method:

function positionGroupByArea() {
   var aGroupAreas = document.getElementsByClassName('ighg_Office2007BlueGroupArea'); 
   var oDivActionControls = $get('xdivNavigation'); 

   if (aGroupAreas.length > 1) {
      oDivActionControls.removeChild(aGroupAreas[0]);
      oDivActionControls.appendChild(aGroupAreas[1])
   } else {
      oDivActionControls.appendChild(aGroupAreas[0])
   }
}

Lines 2-3 Locate Group By area and target DIV respectfully. Note Line 5: like nature abhors a vacuum – WHDG abhors Group By area missing from its default place, if it is missing – grid will try to recreate it. If this happens you will have 2 Group By areas. If code on Line 5 detects this situation it removes old area and re-adds new one. Otherwise it simple moves original area.

You will have to call this code on initial grid load and after every grid operation (sorting, paging etc.) since grid will try to recreate Group By at the old place. Also, if the grid feels jumpy during this move – hide Group By area initially via it’s CSS class by setting display:none and make it visible again after the move.

Overall effect is quite seamless

WHDG: Give Grouped columns correct captions

If you work with Infragistics WebHierarchicalDataGrid and try to use its grouping features, you may notice that it uses grid column keys instead of column header’s captions to name items in “Group By” area.

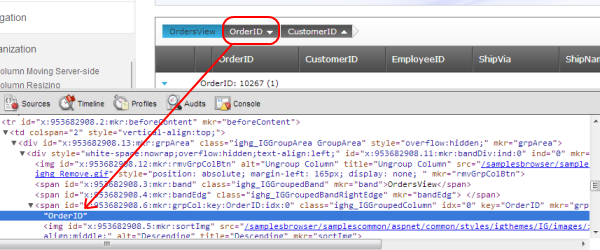
To work around this limitation, let’s take a look at how Grouped By area is rendered:

Group By Area in WebHierarchicalDataGrid

Basically a container DIV holds a bunch of SPANs representing grouped columns. Both DIV and SPAN can be located by their CSS class (your own, if it’s assigned or Infragistics StyleSet class name, used by the grid control). Knowing the location of the SPANs we can loop thru them altering their text:

function renameColumnsInGroupByArea() {

   //locating GroupBy area DIV 
   var oGroupArea = document.getElementsByClassName('ighg_IGGroupArea')[0]; 

   //locating GroupedColumn SPANs
   var aGroupedColumns = oGroupArea.getElementsByClassName('ighg_IGGroupedColumn');

   // looping thru SPANS with grouped columns, replacing their text
   for (var I = 0; I < aGroupedColumns.length; I++) {
      aGroupedColumns[I].firstChild.nodeValue = // put your new value here;
   }
}

One way of using this function is generate a JavaScript associative array (ColumnData['ColumnKey'] = 'Column Caption') in ASP.NET server side code. Armed with such array Line 11 in the previous code could be simple

aGroupedColumns[I].firstChild.nodeValue = ColumnData[aGroupedColumns[I].firstChild.nodeValue]

Position:Absolute within Position:Absolute

Let’s say we have a basic HTML layout: a container DIV and within it another DIV and an image:

<div id="xdivContainer">
   <div id="xdivMenu" style="position:absolute"></div>
   <img id="ximgIcon" src="icon.gif" />
</div>

Inner (child) div is positioned absolutely and we want to place it at the coordinates of the image (think popup menu appearing on icon click). A very basic JavaScript function obtains position of the image:

// Class placeholder for coordinates
function CTopLeft(i_nTop, i_nLeft) {
   this.nTop = i_nTop;
   this.nLeft = i_nLeft;
}

// obtain position of a DOM element
function GetTopLeft(i_oElem) {
   var cTL = new CTopLeft(0, 0);
   var oElem = i_oElem;

   while (oElem) {
      cTL.nLeft += oElem.offsetLeft;
      cTL.nTop += oElem.offsetTop;
      oElem = oElem.offsetParent;
   }
   
   return cTL;
}

As you can see it simple collects offset positions of the HTML element, combining them into absolute coordinates. So to absolutely position our child DIV at the coordinates of the image we can call it like this (I am using $() notation as a shortcut for document.getElementById)

var oPos = GetTopLeft($('ximgIcon'));
$('xdivMenu').style.top = oPos.nTop + 'px';
$('xdivMenu').style.left = oPos.nLeft + 'px'

And it works fine. Until container DIV is in turn absolutely positioned: Continue reading →